Editorial Solution
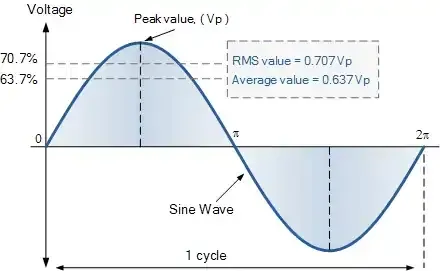
- Peak_voltage = ( maximum_voltage - minimum_voltage ) / 2
- RMS_voltage = Peak_voltage * 0.707
- Avg_voltage = Peak_voltage * 0.637
In our task, we have to detect and print the Peak Voltage, RMS Voltage, and Average Voltage.
The peak value is the difference between the maximum value and the mean line value of the sine wave. But we also know that the difference between minimum voltage and maximum voltage (peak to peak voltage) is twice V_peak.
Peak_voltage = voltage_peak_to_peak / 2
Peak_voltage = ( maximum_voltage - minimum_voltage) / 2
RMS value is a measure of the sine wave’s effective value over time. It is always less than the peak value, approximately 0.707 times the peak for a sine wave.
formula:
Voltage_RMS = V_peak / sqrt(2)
which is equivalent to,
Voltage_RMS = 0.707 * V_peak
The voltage rating you see in power outlets (e.g., 230V or 120V) is typically the RMS value, not the peak value. For example, in the US, the peak voltage in a 120V RMS outlet is actually around 170V. RMS value represents the average power delivered over a full cycle.
The average value of a sine wave represents the arithmetic mean of the wave's values over a complete cycle. However, because the sine wave oscillates symmetrically above and below zero, the average value of a complete cycle of a pure sine wave is zero (positive and negative halves of the cycle cancel each other out.).
For that reason we consider only the Peak voltage (V_peak) to derive the average value.
formula
V_average = 2/π * V_peak
Which is equivalent to
V_average = 0.637 * V_peak
Generating Sine Wave
We can use the signal generator for that purpose, but most of us don't have it, right? It turns out we can use ESP32 or any controller with DAC as a signal generator.
Caution: External Sinewave generated should be between 0 to 5 volts, any voltage beyond this will damage the controller.
Here is a detailed reference to ESP32 as a signal generator: Using the ESP32 DAC
We can see, that the waveform generated is DC-shifted.
The code we are using for ESP32 sine-wave generation is as below:
Code
// Define DAC pins
#define DAC_CH1 25

void setup() {
  // Nothing here!
}

void loop() {

  // Generate a Sine Wave
  // Step one degree at a time
  for (int deg = 0; deg < 360; deg = deg + 1) {
    // Calculate sine and write to DAC
    dacWrite(DAC_CH1, int(128 + 64 * sin(deg * PI / 180)));
  }
}
Code Explanation
dacWrite(pin, value): This function outputs an analog voltage of 0 Volts to 3.3 Volts for values ranging between 0 to 255.sin(deg * PI / 180): The sin() function takes the angle as input (in unit radians) & outputs the sine value. Observe the below table, the changes in the degree values and output of the sin() function can be seen:
| Degree | Output of sin() function |
| 0° to 90° | 0 to 1 |
| 90° to 180° | 1 to 0 |
| 180° to 270° | 0 to -1 |
| 270° to 360° | -1 to 0 |
128 + 64 * sin_value: The second value in the formula is “64”. It is the amplitude. The amplitude value can be varied from 0 to 127 (if the value “64” in the formula is changed to 128, it will write 256, which produces 0V on DAC.)
NOTE: In the below point the second value 64 in the formula 128 + 64 * sin_value is changed to 127 (maximum amplitude) for ease of understanding.
128 + 127 * sin_value: The first value “128” in the formula shifts OUTPUT voltage by +1.65 Volts. This is important because if the sin() function outputs 0 the DAC output will be 1.65 Volts. If the sin() function outputs -1, the voltage will be 0 Volts.
Many of us also don’t have an oscilloscope. How will we verify that our Arduino is giving correct values? We have an option for that: we can use Arduino Serial Plotter.
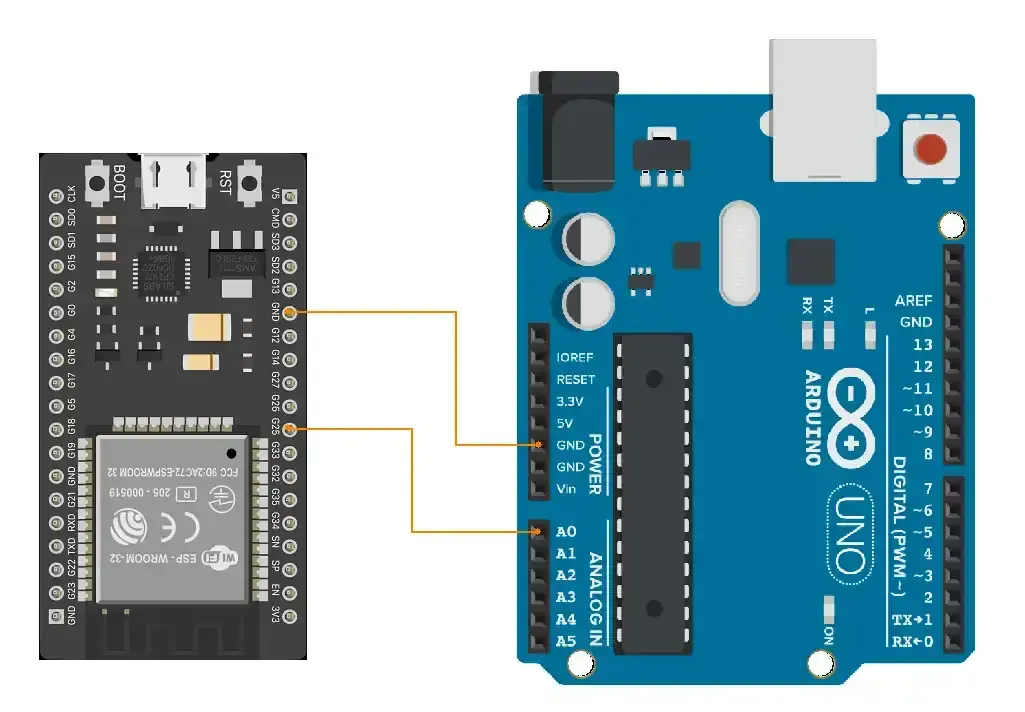
The circuit we will use is :
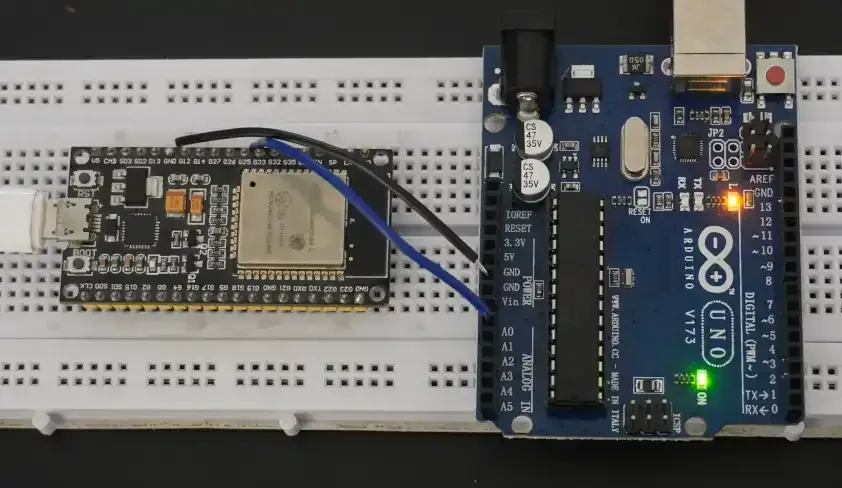
- (ESP32) pin 25 → (Arduino) pin A0
- Common ground.
Connection
The approach to the code will be as follows :
- We will analyze the ADC value for 1 second to get min. and peak values.
- It will help us to calculate the values for a waveform with frequency as low as 1Hz
- Based on the peak value and min value, we will calculate the rest of the values.
Code
#define ANALOG_PIN A0

void setup() {
  Serial.begin(9600);
}

void loop() {
  int peakValue = 0;    // To store the peak value
  int minValue = 1023;  // Initialize with max value to find the minimum

  uint16_t sampling_start_time= millis();

  // take sample for 1 second
  while(millis() - sampling_start_time < 1000){
    int sensorValue = analogRead(ANALOG_PIN);  // Read the analog value

    // Track the peak value (highest value)
    if (sensorValue > peakValue) {
      peakValue = sensorValue;
    }

    // Track the minimum value (lowest point of the wave)
    if (sensorValue < minValue) {
      minValue = sensorValue;
    }
  }

  double peakVoltage = (peakValue - minValue) / 2.0; // peak Value calculation
  peakVoltage = (peakVoltage / 1023.0) * 5.0;  // Convert to voltage

  // calculate RMS volatge
  double rmsVoltage = peakVoltage / sqrt(2);

  // calculate average voltage
  double avgVoltage = 0.637 * peakVoltage;

  // Print the results on the Serial Monitor
  Serial.print("Peak Voltage: ");
  Serial.print(peakVoltage, 3);

  Serial.print("\tRMS Voltage: ");
  Serial.print(rmsVoltage, 3);

  Serial.print("\tAverage Voltage: ");
  Serial.println(avgVoltage, 3);

  delay(100);
}
Code explanation
We need to collect the samples of a waveform over 1 second.
millis() - sampling_start_time < SAMPLING_DURATION: read and compare samples for 1 second.peakValue, minValue: The maximum value and minimum value that has occurred in 1 second are stored in these variables.peakVoltage = (peakValue - minValue) / 2.0:This formula calculates peak_voltgae but its in analog value i.e. in the 0 - 1024 range.peakVoltage = (peakVoltage / 1023.0) * 5.0: here the peak voltage gets converted from analog_value to actual Voltage.rmsVoltage = peakVoltage / sqrt(2): This formula calculates RMS voltage value using peak_voltage.avgVoltage = 0.637 * peakVoltage: This formula calculates the average voltage value.
Output
The Output sine waveform from the ESP32 is given below
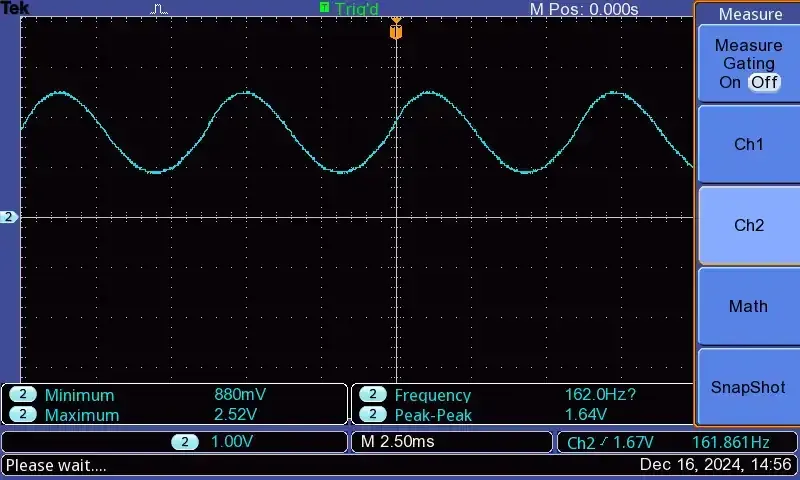
We can see in the oscilloscope that Peak to Peak voltage is 1.64 Volts. The Peak voltage in this case is half of it. Thus,
Vpeak = (v-peak-to-peak / 2)
Vpeak = 1.64 / 2
Vpeak = 0.82 Volts
The connection done for the current task is as follows
The output of Vpeak detected by Arduino and printed on the serial monitor is as follows
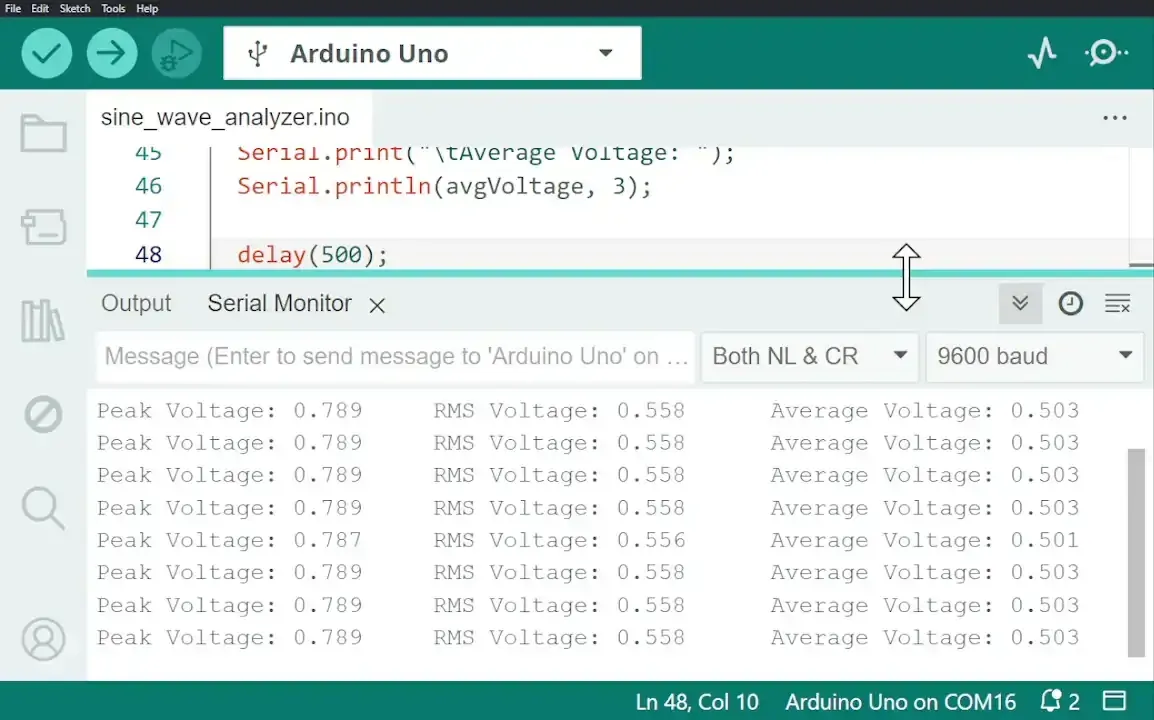
Output video
- As we can see in the video, the Peak voltage and RMS values are successfully detected. The output measured on the Oscilloscope can also be seen.
- More modification can be done in the next version and the amplitude can be varied and the reflections in the sine wave can be seen accordingly.
Limitations
- The output produced by ESP32 is not the same as the calculated voltage. It has a difference of around 100 - 200 mV.
- We need to wait at least 2 seconds after varying the amplitude to get proper and stable values.