Editorial Solution
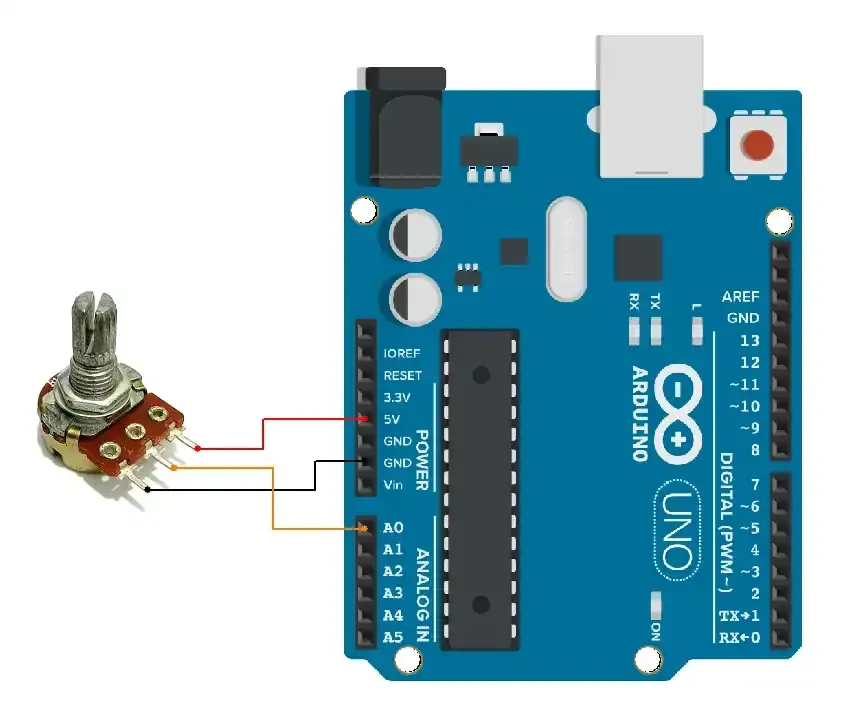
Let’s do the hardware connection. We need a potentiometer to vary input-signal voltage. We can use any potentiometer with value from 1K to 10K ohms.
Connection
Firmware
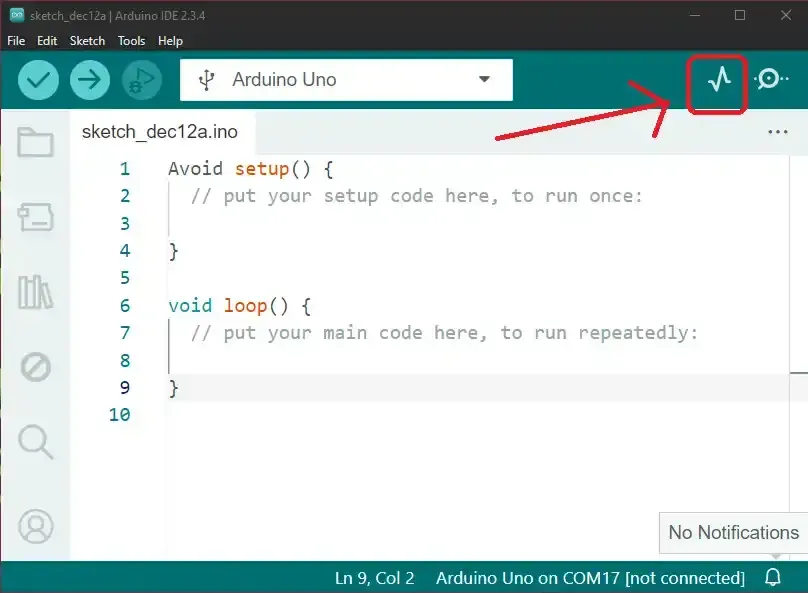
Arduino IDE has a serial plotter tool, we can open it by clicking below
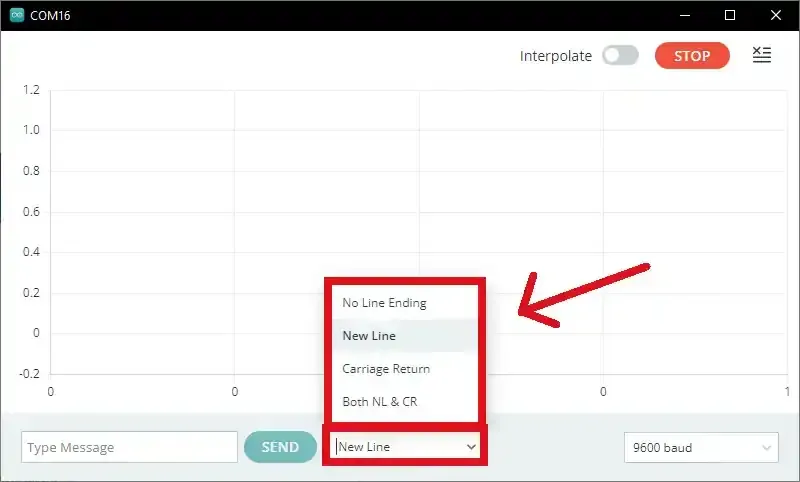
To plot data on the serial plotter, we need to simply send data to the Serial monitor with a new line (Serial.println()), where the new line separates the values.
Let’s code.
Code
void setup() {
  Serial.begin(9600);
}

void loop() {
  // Read the analog values from A0
  int analogValueA0 = analogRead(A0);

  // For the Serial Plotter, just print the values without any text
  Serial.println(analogValueA0);
  delay(100);  // Add a short delay to control the update rate
}
Code explanation
analogRead(analogPin): reads ADC value.Serial.println: print ADC_value on Serial monitor.
Output
The circuit is easy. Shown below
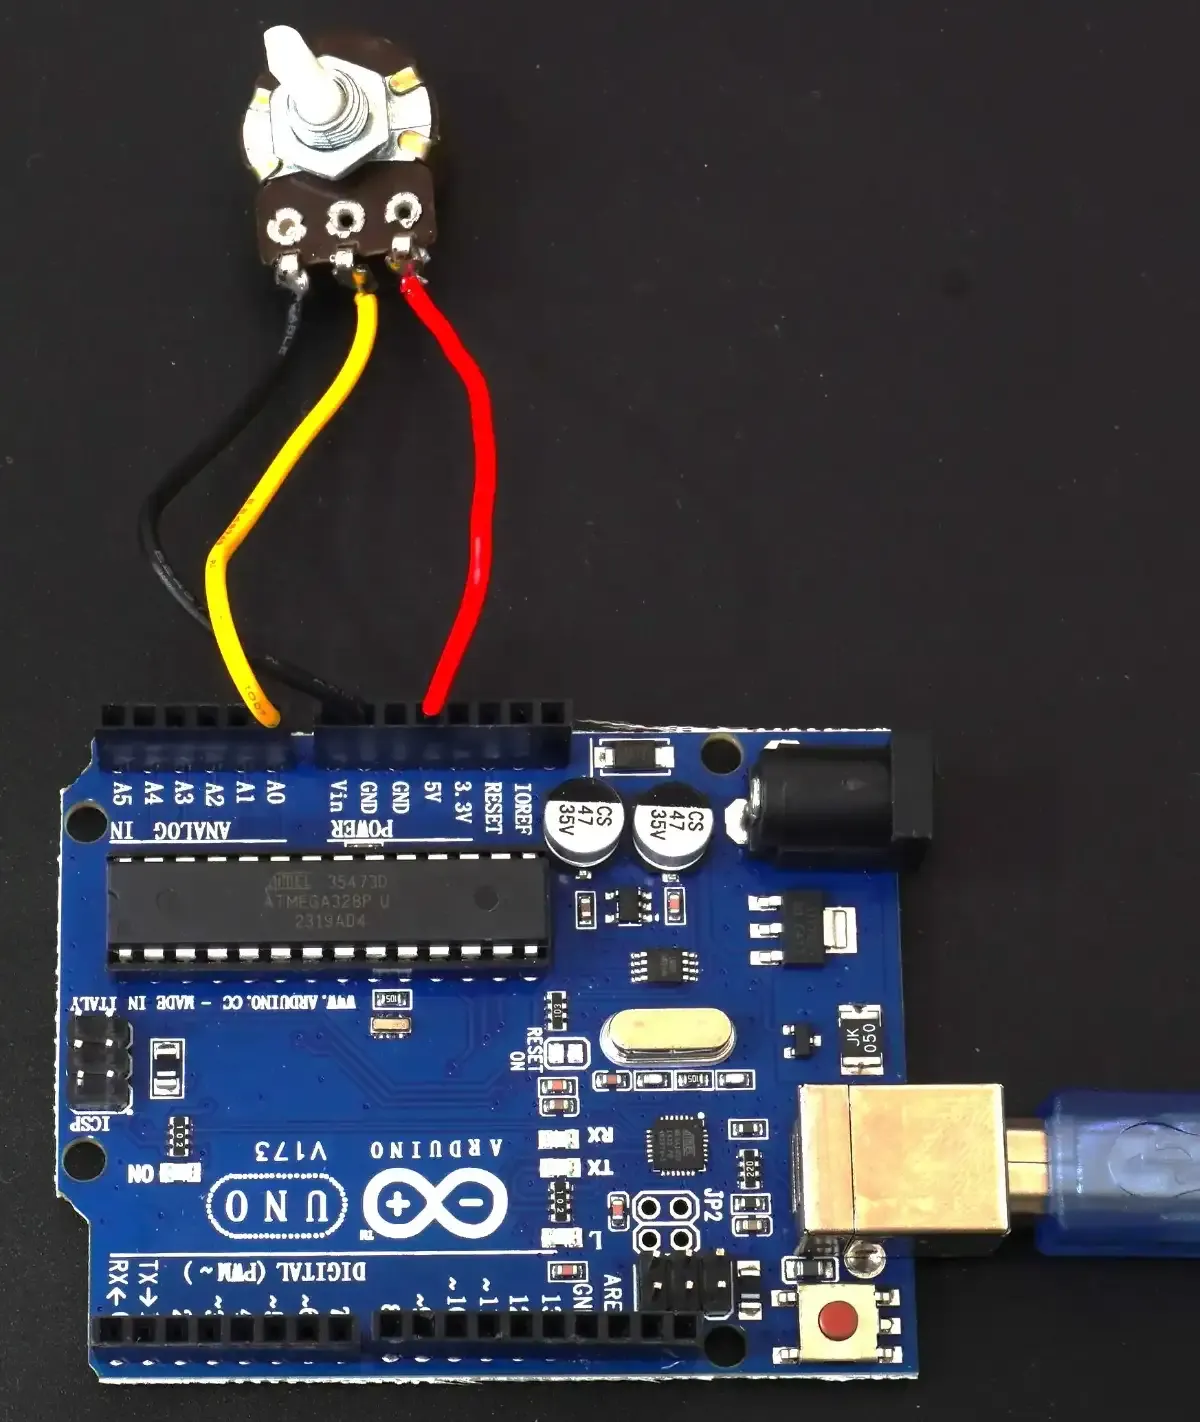
The output of increasing value is as above
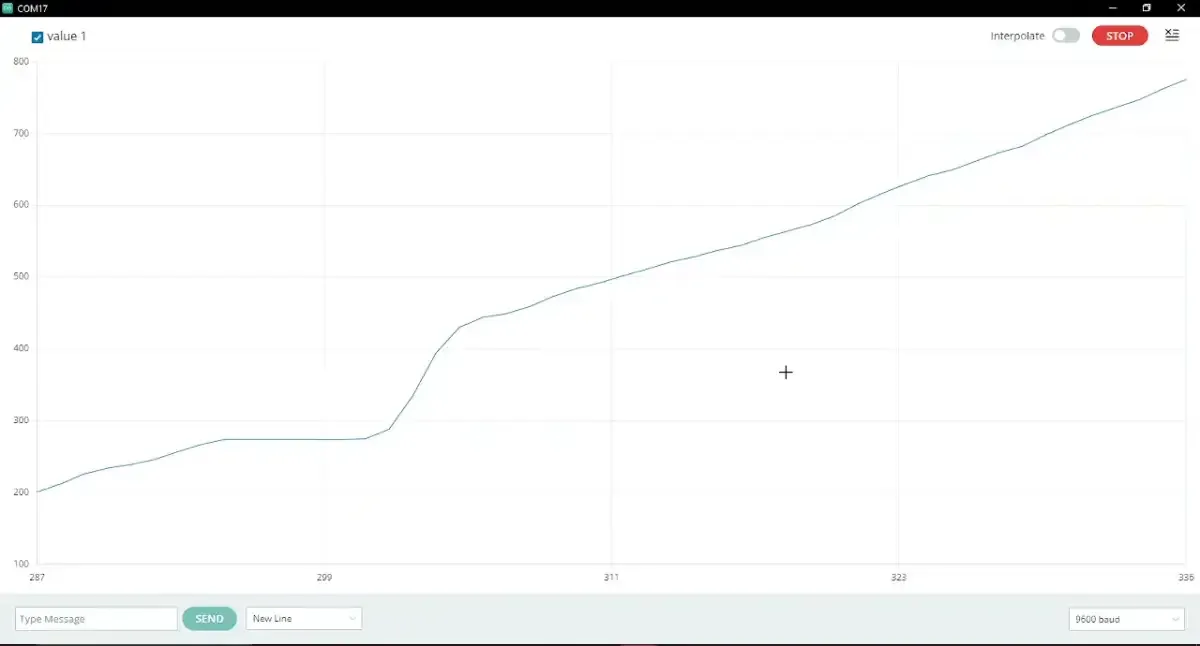
Output video
- As we can see in the video, the Serialplotter plots values w.r.t. a change in the potentiometer.
The serial plotter is one of the very useful features provided by Arduino IDE. It is very easy to understand any data visually, rather than a list of numbers.
The multiple values can also be plotted simultaneously, using the “\t” tab. If we send 2 values with a tab separating them, both values will be plotted on the Serial plotter simultaneously.
Limitations
- There is no option for vertical and horizontal scrolling so it limits viewing waveform over time range.